
 Publish:2026-10-28
 Source:ReedBiotech
 Views:29
The latest immunoassay market report released by MarketsandMarkets provides the following figures: the global immunoassay market was valued at US$31.65 billion in 2026 and is expected to reach US$44.49 billion by 2031, with a compound annual growth rate (CAGR) of 7.0%. The report also notes that chemiluminescence immunoassay (CLIA) currently holds the largest market share (about 49.7% in 2025), while ELISA remains an important segment of the immunoassay field.
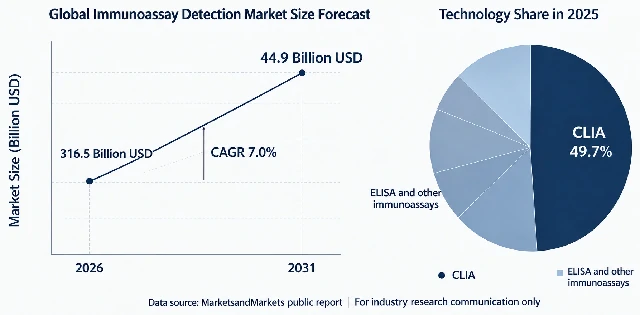
These figures are more than just market statistics. For researchers who measure proteins every day, they point to a more practical question: Which method should I choose for my study?
Looking back at more than half a century of immunoassay development makes the answer clearer: technological progress is about continuously addressing the needs of specific applications, not replacing the previous generation of technology.
1959: RIA — Making “Trace Amounts” Measurable for the First Time
Radioimmunoassay (RIA), introduced in 1959, marked the beginning of quantitative immunoassay. Yalow and Berson used radioactive iodine to label insulin, making it possible to accurately measure extremely low levels of hormones in blood for the first time. The importance of this work is reflected in the 1977 Nobel Prize in Physiology or Medicine.
However, radioactive labels involve radiation risks, reagents have a short shelf life, and laboratory use requires strict controls. As a result, RIA can only be performed in laboratories with the necessary facilities.
1971: ELISA — Lowering the Barrier to Use
In 1971, two teams in Sweden and the Netherlands independently published work on replacing isotopes with enzyme labels. The Swedish team called its method ELISA, while the Dutch team called it EIA. However, these early methods were different from the formats used today. The Swedish team coupled antibodies to microcrystalline cellulose particles and used a competitive method to measure antibodies; polystyrene tubes were also used that year. The Dutch team labeled hCG with HRP and also used a competitive method, separating bound and free components by centrifugation. Neither paper used microplates.
The microplate method was first reported by Voller and colleagues in 1974 and was described and promoted in detail in a WHO bulletin in 1976. In 1976, the double-antibody sandwich format on microplates also took shape. The ELISA format we know today became established only after researchers had used it for several years.
1980s–1990s: CLIA — More Accurate Signal Detection
Chemiluminescence immunoassay (CLIA) gradually matured during the 1980s and 1990s. Its principle had been proposed as early as 1977. The first fully automated system appeared in the late 1980s, and CLIA became a major method in clinical immunology as automated platforms spread during the 1990s.
Signal reading advanced from visual observation or color measurement with a microplate reader to photon counting. This improved sensitivity and consistency between runs, making CLIA well suited to high-volume testing of standardized clinical samples. This is an important reason why CLIA holds a major share of the market today.
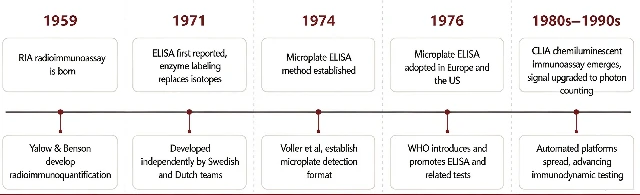
Timeline of Key Immunoassay Technologies
Each Generation Solves Some Problems from the Previous One, but None Solves Them All
This timeline shows that each new technology addresses specific limitations of the previous one, but no technology can meet every need.
RIA offers high sensitivity but involves safety risks. ELISA is flexible and easy to use, has a low learning barrier, works well with many types of complex sample matrices, and is cost-effective, but its sensitivity is limited by colorimetric signal detection. CLIA is consistent and supports high-throughput testing, but it depends on dedicated instruments and can involve high setup requirements. It is also less suitable for complex matrices and small amounts of precious samples.
Market share reflects how widely a technology is used in standardized clinical settings, but it does not mean that the technology is suitable for every research study. Research samples can have different matrices and widely varying biomarker levels. Other needs, such as testing across species and working with precious, low-volume samples, make it difficult for one technology to cover every application.
What Can Be Done About Low-Abundance Targets?
Over the past 20 years, several approaches have been developed to detect low-abundance targets:
First, count the signals one by one. Introduced in 2010, the Single Molecule Array (Simoa) method distributes immune complexes into femtoliter-sized wells and counts them individually. Its detection limit can reach fg/mL levels, 2–3 orders of magnitude lower than that of traditional ELISA. However, it requires a dedicated platform and has a high cost per sample.
Second, convert protein detection into nucleic acid detection — the Proximity Ligation Assay (PLA), first published by a team at Uppsala University in Sweden in 2002.
In PLA, each of two antibodies that recognize different sites on a target is coupled to a short DNA strand. The two strands remain separate under normal conditions. When both antibodies bind to the same antigen molecule and are close enough to each other, the DNA strands can join to form a complete template. The template is then amplified and measured by qPCR. PLA offers low background and high specificity. It can also greatly increase sensitivity: traditional ELISA amplifies signals through enzyme-driven color development, while PLA uses PCR for exponential amplification. In addition, testing requires only a qPCR instrument, not a chemiluminescence analyzer or other dedicated equipment, which is commonly available in molecular biology laboratories.
Reed Biotech’s Two Platforms: ELISA Kits and Ready-to-Use PLA Kits
However, there is a considerable gap between a principle working in theory and a method working reliably in the lab. Probes must be coupled to two separate antibodies, and coupling efficiency affects the maximum signal. If the probes come close together in the absence of the target antigen, background signals may cause false positives. In addition, residual enzymes and salts in the ligation products may inhibit qPCR amplification.
This is exactly what we work on.
Reed Biotech’s two in-house product lines — ELISA kits and VeriQuant immunoassay kits developed using PLA technology — address two different needs in immunoassay testing:
ELISA Kit Series:The Mainstay for Routine Testing
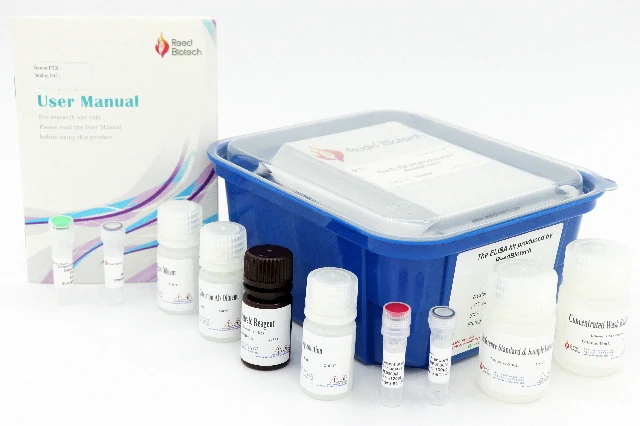
Designed for four types of applications:
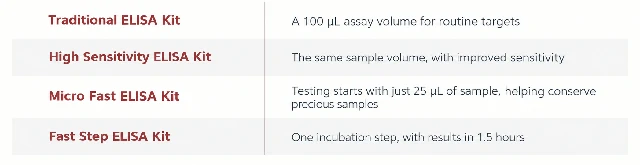
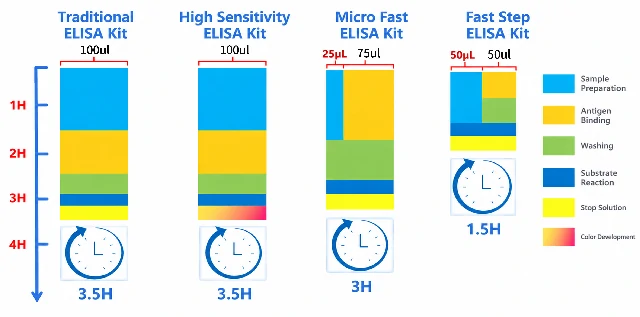
Reed Biotech ELISA Kit Series
VeriQuant:Ready-to-Use Kits Based on Proximity Ligation
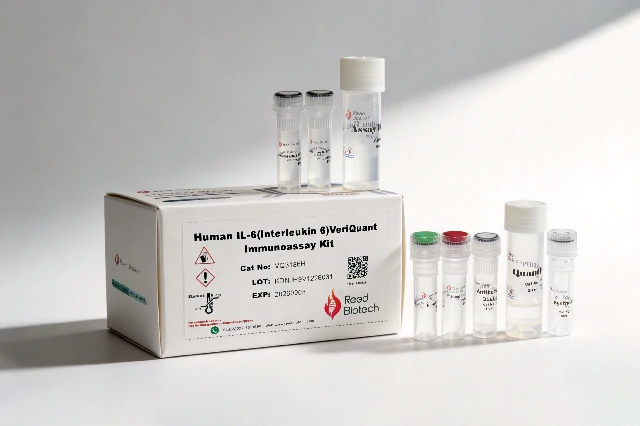
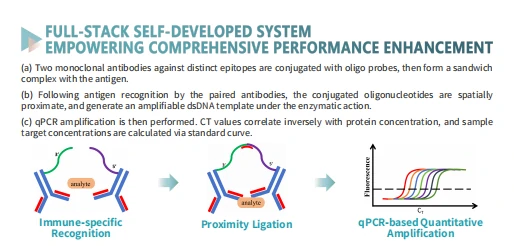
Schematic Diagram of the VeriQuant Technology
The kit includes probe-conjugated antibodies, ligase, and qPCR master mix. There is no need to conjugate the probes yourself or optimize ligation conditions. Simply add the samples according to the instructions.
How Does It Compare with ELISA?
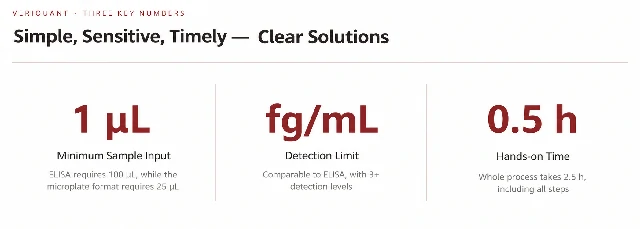
Sample volume: from 100 μL to 25 μL to 1 μL — taking sample-volume requirements two steps further.
Testing can start with 1–5 μL of sample, with as little as 1 μL required. This makes samples such as cerebrospinal fluid and mouse serum more practical to use.
Sensitivity: from pg/mL to fg/mL — improving detection by three orders of magnitude.
Targets that were previously “below the limit of detection” and could not be measured can now be detected.
From 1.5 hours of continuous hands-on work to just 0.5 hours of hands-on time
Testing becomes a matter of “add the samples and let the instrument run.” VeriQuant takes 2.5 hours in total, but only the first 30 minutes require hands-on work. The qPCR instrument runs the remaining steps automatically, so there is no need to stay by the instrument during the run.
Before Choosing a Method, Ask Yourself Three Questions
▫️ What is the matrix of your sample?
▫️ Is your target present at a typical level, or is it a low-abundance protein?
▫️ Are you screening a large number of samples, or working with a small number of precious samples?
The answers to these three questions will largely determine which approach to use. If a supplier does not ask these questions and simply offers a “one-size-fits-all” solution, it may not be the best choice.
A technology that has remained in use for decades must have applications where it cannot be replaced. New technologies develop to fill the gaps that existing methods cannot address.
The right solution is the one that matches your sample conditions, produces consistent and reproducible data, and meets the needs of your research.