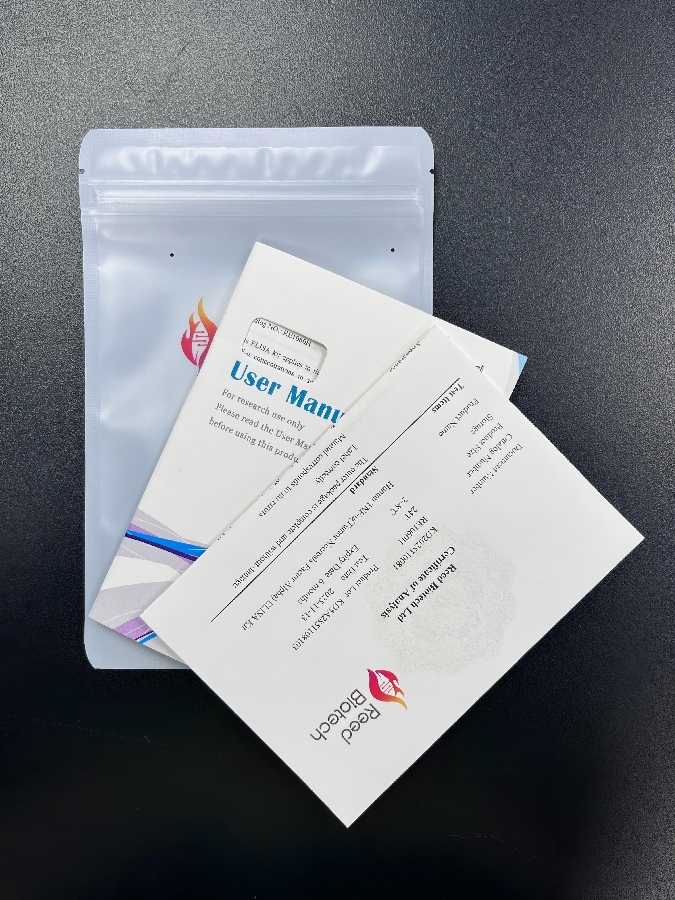
Every ELISA kit from Reed Biotech comes with a Quality Control Report and an Instruction Manual, which contain detailed performance parameters. But what do these parameters actually mean?
01. Quality Control Report
The Quality Control Report included in each ELISA kit confirms that the kit meets our manufacturing standards before shipment — including complete components, intact appearance, and no signs of deterioration.
It also verifies that the kit satisfies key performance criteria such as:
Good standard curve linearity (R² ≥ 0.99)
Low intra-assay variation (<10%)
These ensure that every researcher receives a kit meeting our strict quality standards.
02. Specificity
Specificity is evaluated by testing the kit’s ability to detect the target protein without cross-reacting with similar proteins. The cross-reactivity rate is calculated as follows:

The lower the cross-reactivity (typically <10%), the higher the specificity of the kit.
Example:
When using the Human Growth Hormone (GH) ELISA kit to detect 5000 pg/mL of recombinant human CG, HGF, GM-CSF, IGF-1, FGF1, and FGF4, as well as recombinant mouse and rat GH, CG, and GM-CSF, the results show very low cross-reactivity, indicating excellent specificity.
|
Recombinant protein |
Concentration(pg/mL) |
Cross-Reactivity |
Recombinant protein |
Concentration(pg/mL) |
Cross-Reactivity |
|
Human CG |
/ |
/ |
Rat GH |
51.44 |
1.0309% |
|
Human HGF |
/ |
/ |
Rat CG |
48.658 |
0.9732% |
|
Human GM-CSF |
/ |
/ |
Rat GM-CSF |
/ |
/ |
|
Human IGF-1 |
/ |
/ |
Mouse GH |
58.658 |
1.1732% |
|
Human FGF1 |
/ |
/ |
Mouse CG |
47.946 |
0.9589% |
|
Human FGF4 |
/ |
/ |
Mouse GM-CSF |
/ |
/ |
03. Detection Range
During the development process, the R&D team selects the most appropriate detection range for each target indicator. After determining the optimal range, the corresponding concentration is converted to a lyophilized concentration, and the standard product is lyophilized accordingly.
For example:
If one vial of lyophilized standard contains 500 pg, the maximum detection concentration of the kit is 500 pg/mL. When the standards are serially diluted two-fold, the detection range is 7.81–500 pg/mL.
04. Sensitivity
To determine the sensitivity, the standard and sample diluent are measured 20 times each. The mean (x) and standard deviation (sd) are then calculated.
The concentration corresponding to the mean ± 2 standard deviations represents the kit’s sensitivity.
|
Method |
Sandwich Assay |
Competitive Assay |
|
Sensitivity |
x+2sd |
x-2sd |
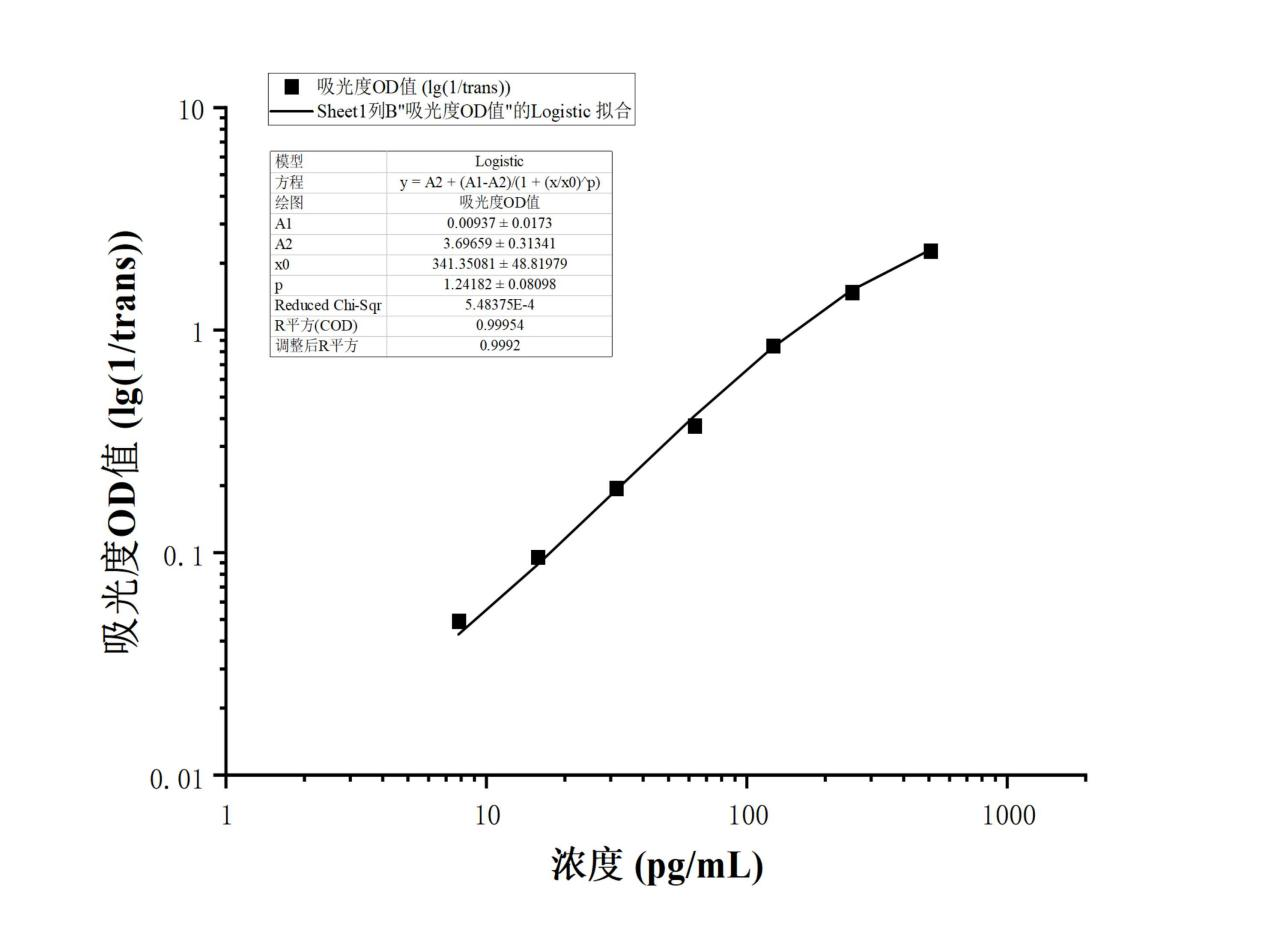
05. Typical Data
The OD value range and correlation coefficient of the kit are evaluated using the standard solutions.
When the standard curve is fitted using a four-parameter logistic (4PL) model, the correlation coefficient (R²) within the specified standard concentration range should be ≥ 0.99.
06. Precision
Intra-assay Precision
Within the same laboratory, the same operator measures low-, medium-, and high-concentration samples on a single plate, performing 20 replicates for each concentration.
The coefficient of variation (CV) for sample concentrations should be <10%.
Inter-assay Precision
Within the same laboratory, at least three operators measure low-, medium-, and high-concentration samples on three different plates, each with 20 replicates.
The CV for sample concentrations should also be <10%.
The evaluation of both intra-assay and inter-assay precision is conducted to assess the reproducibility of results, which is an essential prerequisite for ensuring measurement accuracy.
07. Recovery Rate
What does recovery rate mean?
The recovery rate reflects whether a sample allows accurate detection of the target protein.
Recovery rate is determined by spiking known concentrations of the target protein into the sample matrix, then measuring the detected concentration. The ratio between the measured value and the actual value represents the recovery rate.
This serves as a verification of sample suitability (matrix interference) and measurement accuracy.
Typically, recovery experiments are performed using plasma, serum, and cell culture media.
Reed Biotech requires that the recovery rate falls within the range of 80–120%.

For example:
|
Standard Concentration(ng/mL) |
Sample&Spiked Sample |
Actual Concentration(ng/mL) |
Spike Recovery Rate(%) |
|
200 |
Mouse Serum (Undiluted) |
14.61 |
/ |
|
100 |
Mouse Serum x10 |
15.86 |
/ |
|
50 |
Mouse Serum x10+50ng/mLSandard |
62.11 |
92.5%=(62.11-15.86)/50×100% |
|
25 |
Mouse Serum x10+25ng/mLSandard |
45.58 |
118.88%6=(45.58-15.86)/25×100% |
|
12.5 |
Mouse Serum x10+12.5ng/mL Sandard |
30.62 |
118.08%=(30.62-15.86)/12.5×100% |
08. Dilution Linearity / Dilution Recovery
Samples containing or spiked with high concentrations of the analyte are serially diluted at multiple gradients (both undiluted and diluted samples should fall within the kit’s detection range).
The dilution recovery rate is calculated as the ratio of the measured concentration of the diluted sample to that of the undiluted sample (dilution factor = 1).
Testing dilution recovery helps to eliminate potential interference caused by the sample matrix, hook effect, or improper dilution technique.
Typically, plasma, serum, and cell culture media are used for dilution recovery testing.
A dilution recovery rate between 80% and 120% is considered acceptable.

For example:
|
Serum sample dilution factor |
Actual Concentration(ng/mL) |
Dilution Recovery Rate(%) |
|
1(Undiluted Sample) |
1461.43 |
/ |
|
2 |
1586.648 |
108.57%=1586.648/1461.43×100% |
|
4 |
1601.584 |
109.59%=1601.584/1461.43×100% |
|
8 |
1663.565 |
113.83%=1663.565/1461.43×100% |
|
16 |
1254.087 |
85.81%=1254.087/1461.43×100% |
09. Sample Measurements
During the development phase, our R&D team validates ELISA kits using serum, plasma, and routine laboratory cell samples corresponding to the target species.
For mouse and rat kits, validation also includes tissue homogenates from heart, liver, spleen, lung, kidney, and brain.
For human kits, validation additionally covers samples such as urine and saliva.
However, measurements from cell culture supernatants can be influenced by multiple factors, including:Cell type,Cell number,Cell growth state,Culture medium composition,Interfering substances,System pH
These factors may cause abnormal results (e.g., false negatives) when using the ELISA method.
For any issues or technical questions, please contact our professional support team:
Mr. Zeng: +86 15327141758
Ms. Ma: +86 15342250750