Size:
96 T
48 T
Price:
$459.00
$329.00
Delivery: Order now, ship in 3 days
| Product Name | FS-Rat sCD86(Soluble Cluster of Differentiation 86) ELISA Kit | Species | Rat |
| Uniprot ID | N/A | Alternative Names | Activation B7-2 antigen, B70, B7-2 antigen, B72, B7-2, B-lymphocyte activation antigen B7-2, BU63, CD28 antigen ligand 2, CD28LG2B7-2 antigen), CD86 antigen, CD86 molecule, CD86, CTLA-4 counter-receptor B7.2, FUN-1, LAB72, MGC34413, T-lymphocyte activation antigen CD86 |
| Detection method | Sandwich | Sensitivity | 8.93 pg/mL |
| Standard | 1000pg/mL | Detection Range | 15.63-1000pg/mL |
| Sample type | Serum, Plasma;Sample Volume=50μL | ||
| Reaction time | 1.5H | Research Area | Endocrinology; |
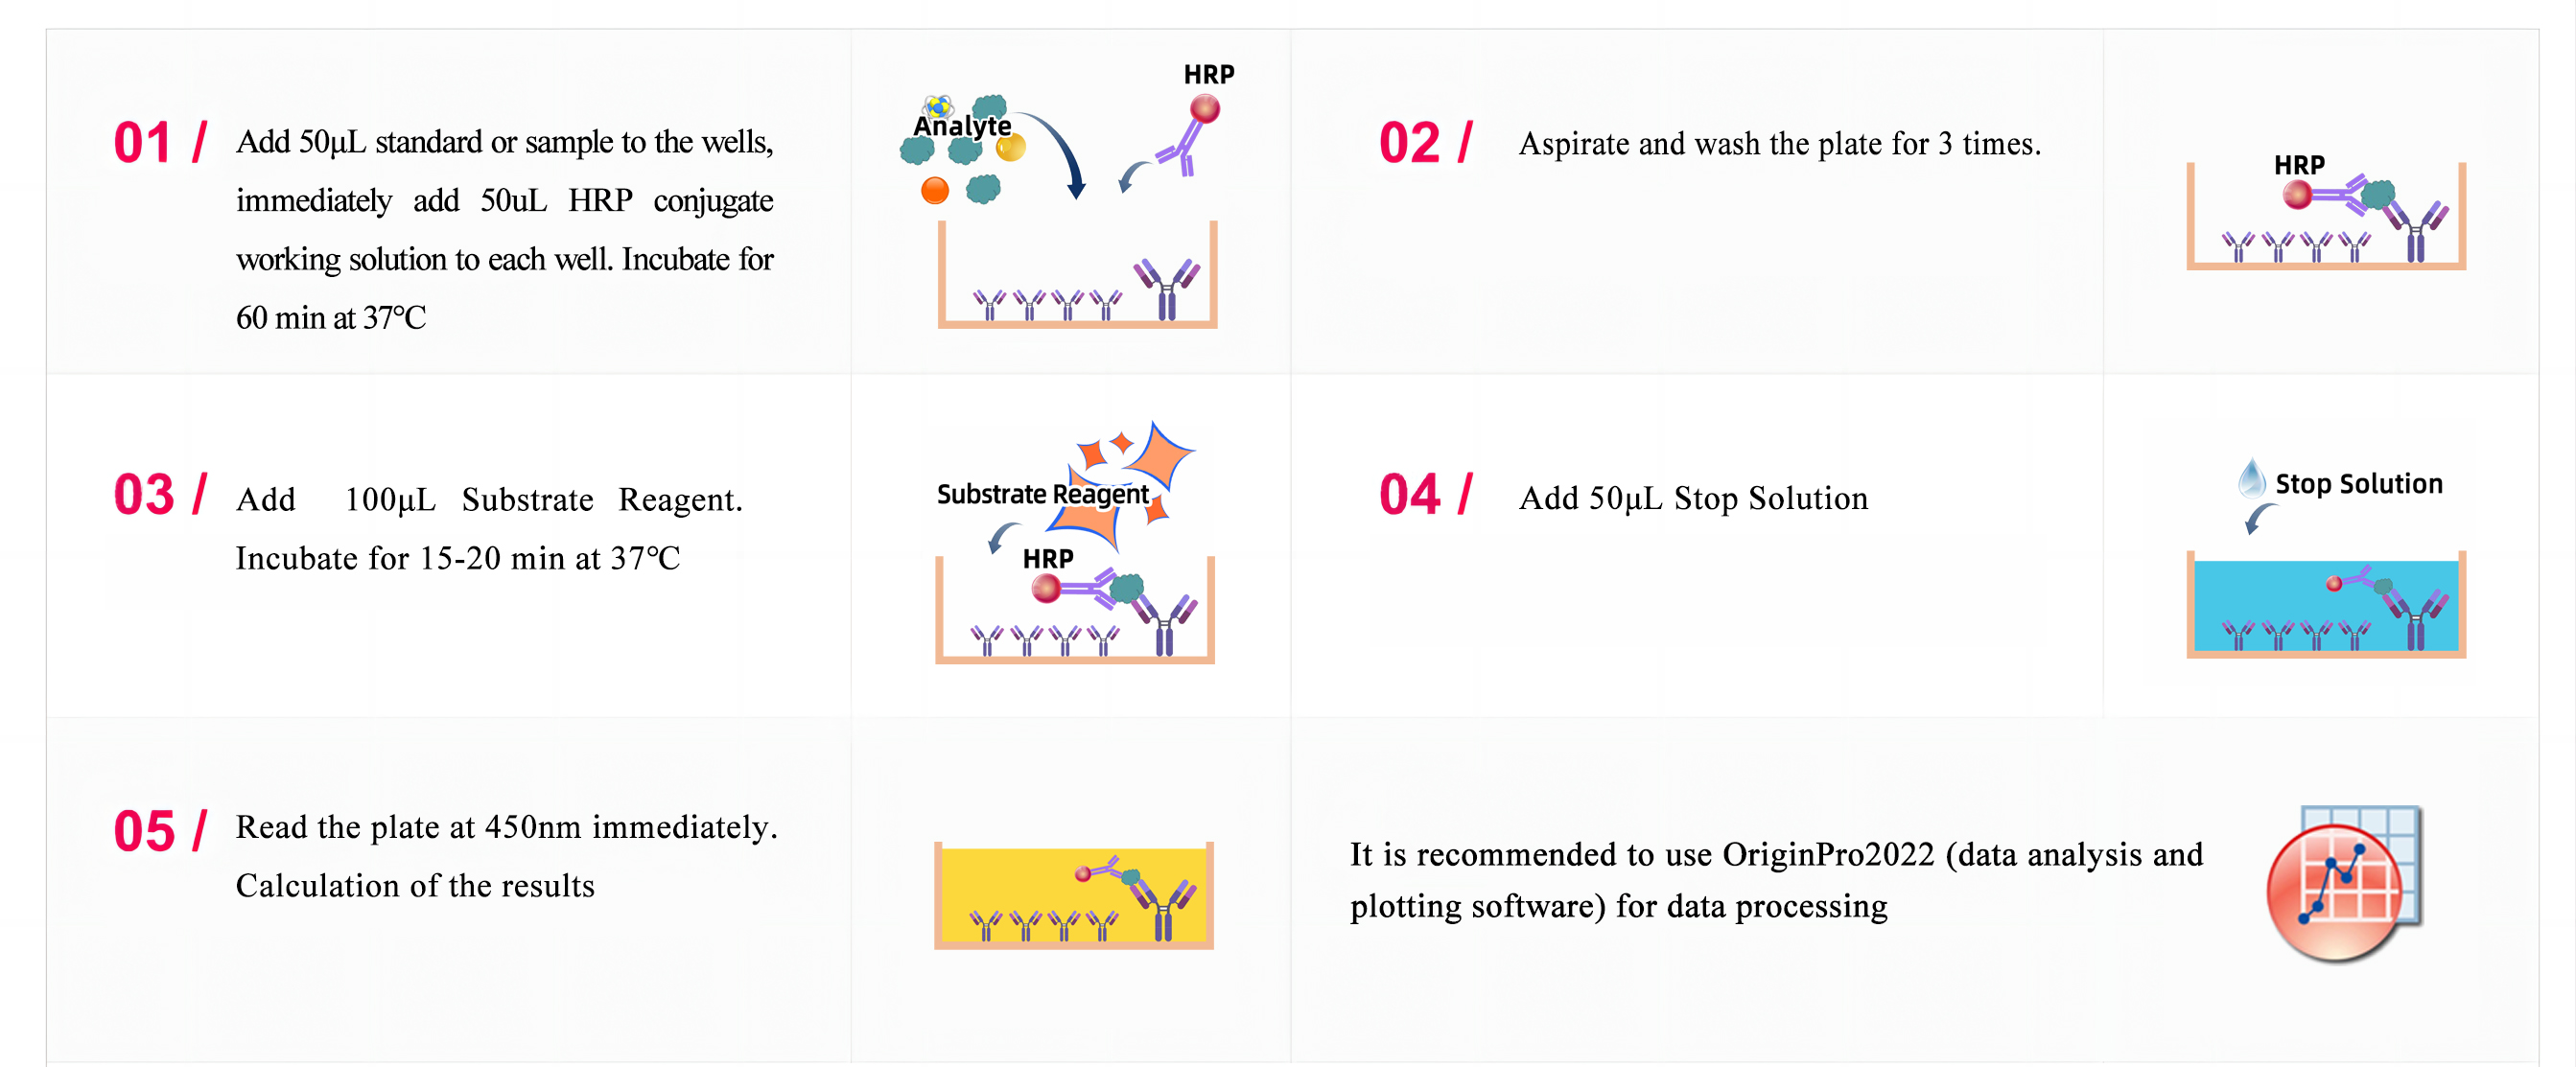
| Test principle | This ELISA kit uses the Sandwich-ELISA principle. The micro ELISA plate provided in this kit has been pre-coated with an antibody specific to Rat sCD86. Samples (or Standards) and Horseradish Peroxidase (HRP) linked antibody specific for Rat sCD86 are added to the micro ELISA plate wells. Rat sCD86 in samples (or standards) combines with the coated antibody and HRP linked detection antibody special to Rat sCD86. Excess conjugate and unbound sample or standard are washed from the plate. The substrate solution is added to each well. The enzyme-substrate reaction is terminated by the addition of stop solution and the color turns yellow. The optical density (OD) is measured spectrophotometrically at a wavelength of 450±2 nm. The OD value is proportional to the concentration of Rat sCD86. The concentration of Rat sCD86 in the samples is then determined by comparing the OD of the samples to the standard curve. | ||
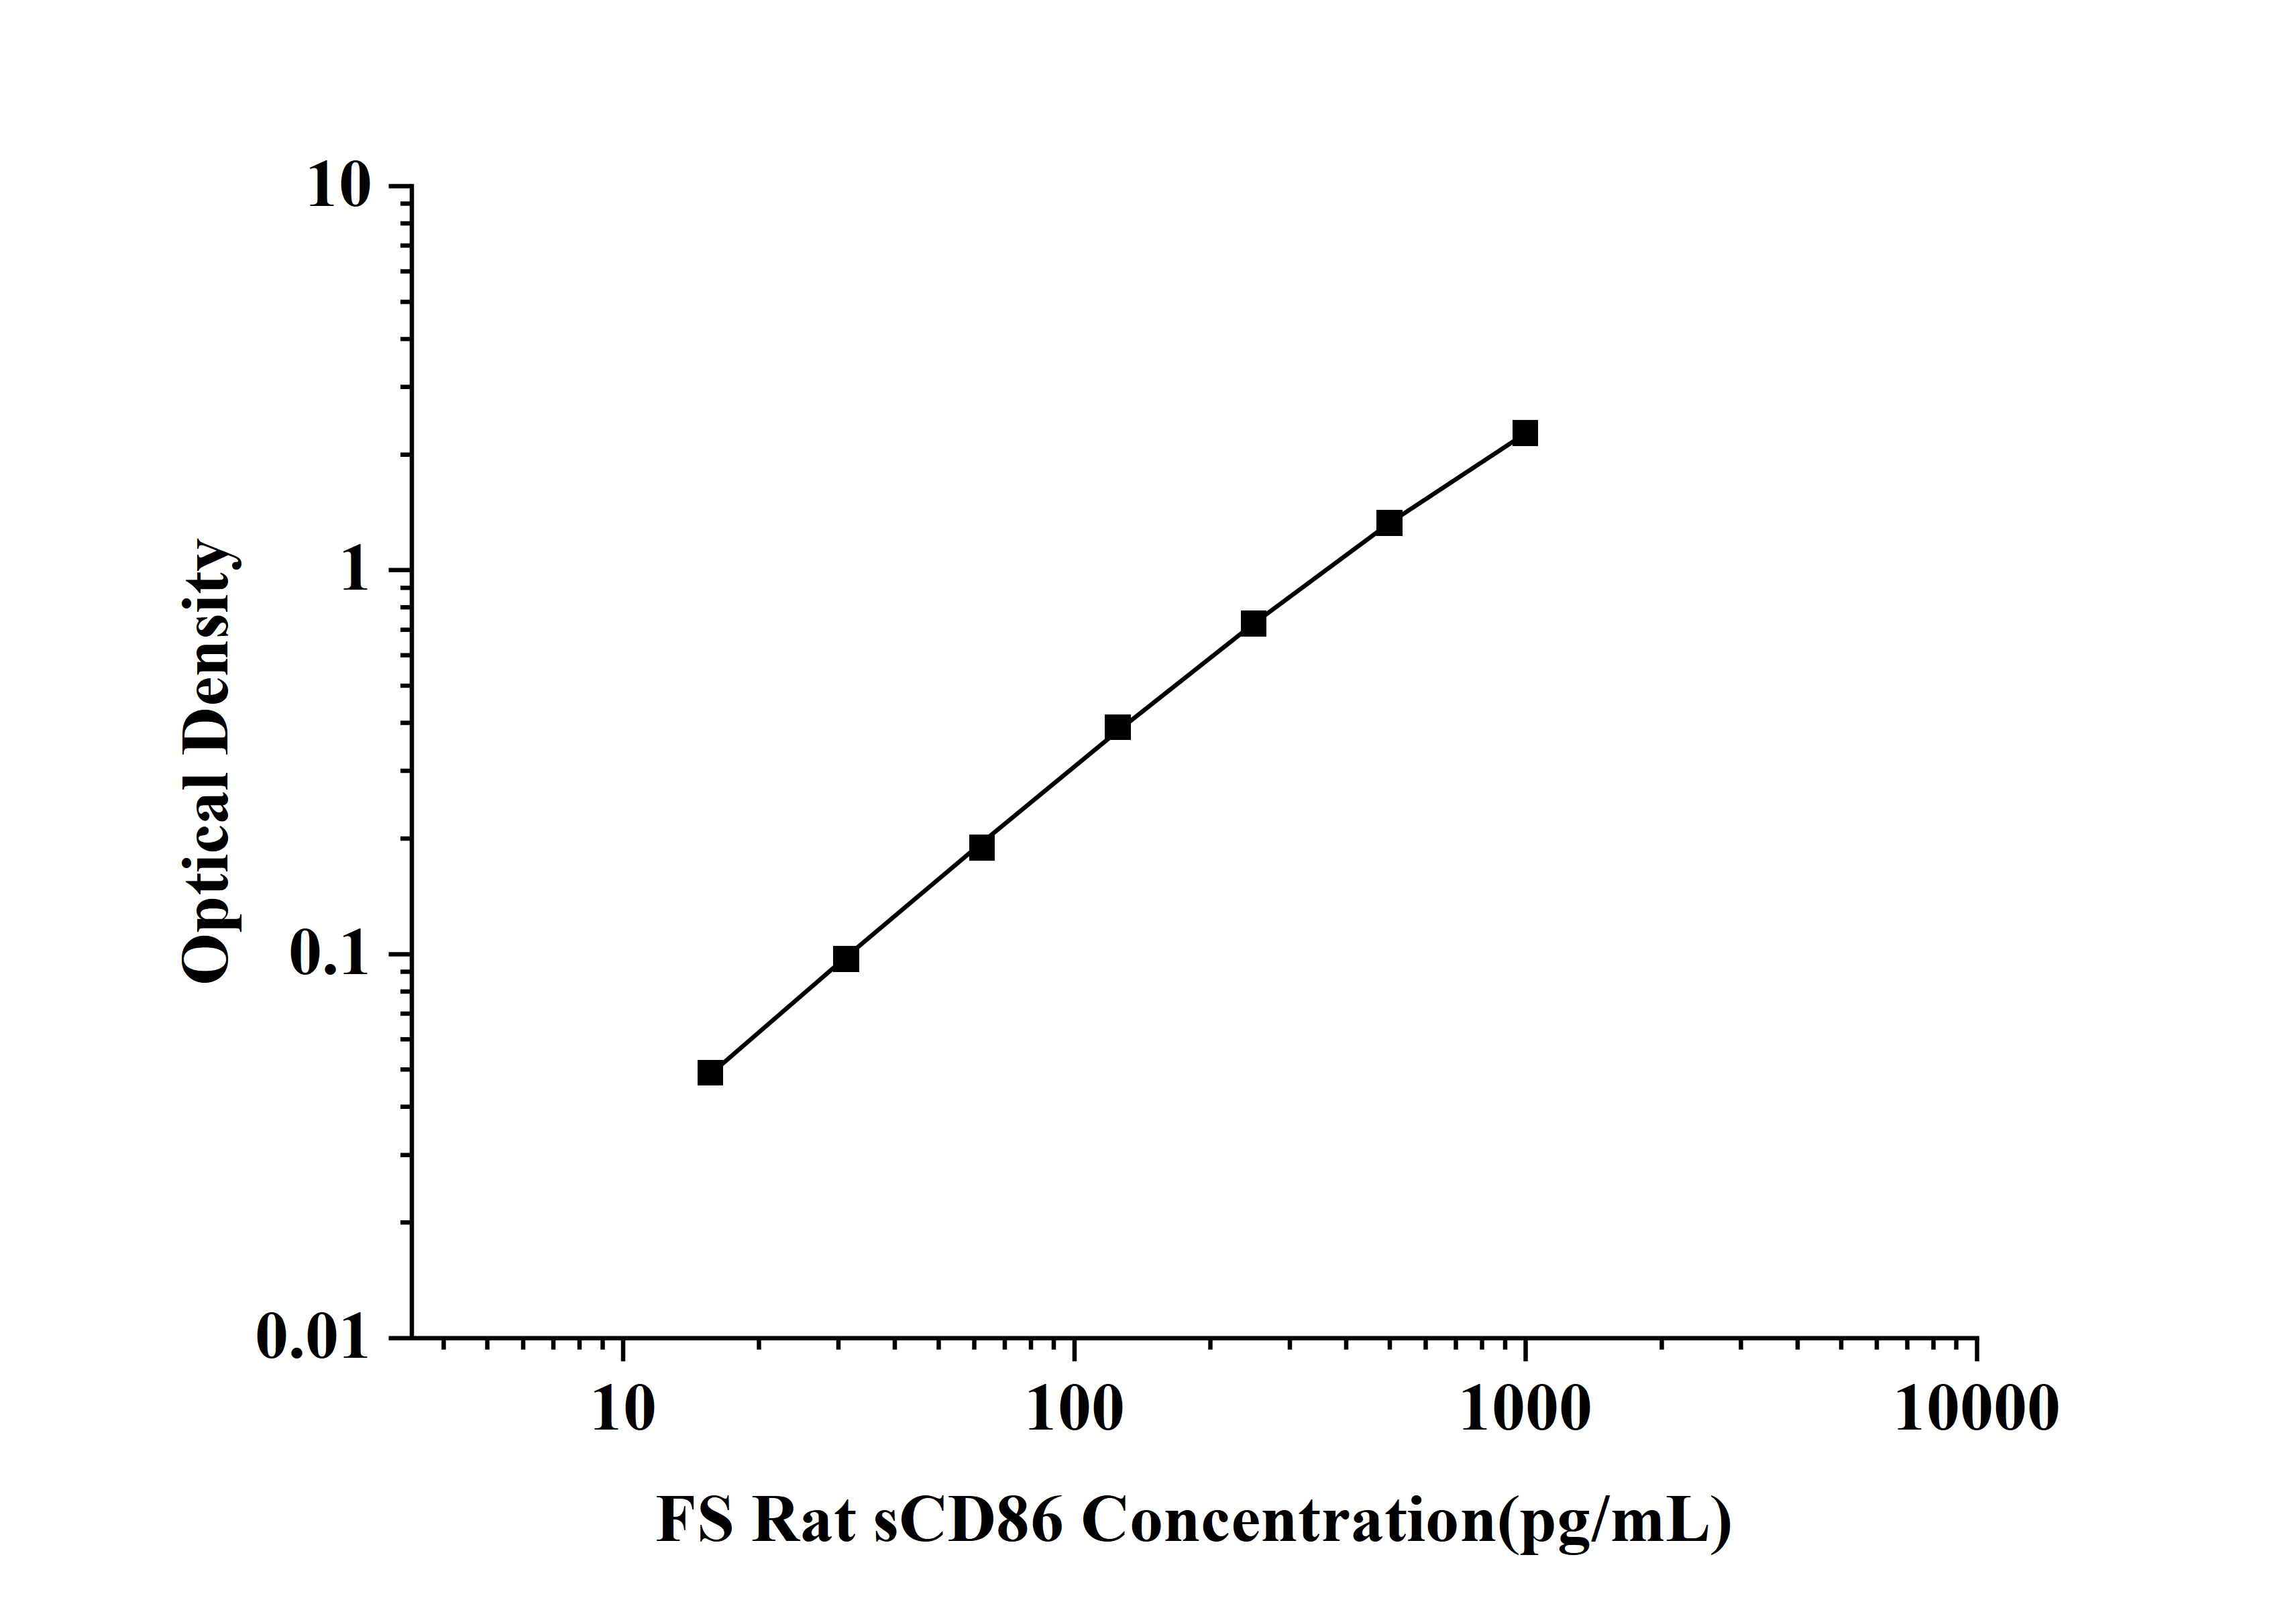
As the OD values of the standard curve may vary according to the conditions of the actual assay performance (e.g. operator, pipetting technique, washing technique or temperature effects), the operator should establish a standard curve for each test. Typical standard curve and data is provided below for reference only.
| (pg/mL) | OD | Corrected |
|---|---|---|
| 1000.00 | 2.306 | 2.272 |
| 500.00 | 1.361 | 1.327 |
| 250.00 | 0.760 | 0.726 |
| 125.00 | 0.423 | 0.389 |
| 62.50 | 0.223 | 0.189 |
| 31.25 | 0.131 | 0.097 |
| 15.63 | 0.083 | 0.049 |
| 0.00 | 0.034 | 0.000 |
Intra-assay Precision (Precision within an assay): 3 samples with low, mid range and high level were tested 20 times on one plate, respectively.
Inter-assay Precision (Precision between assays): 3 samples with low, mid range and high level were tested on 3 different plates, 20 replicates in each plate, respectively.
| Intra-assay Precision | Inter-assay Precision | |||||
|---|---|---|---|---|---|---|
| Sample | 1 | 2 | 3 | 1 | 2 | 3 |
| n | 20 | 20 | 20 | 20 | 20 | 20 |
| Mean(pg/mL) | 725.638 | 907.023 | 847.911 | 38.154 | 219.575 | 88.416 |
| Standard deviation | 0.924 | 5.134 | 2.503 | 10.047 | 7.363 | 1.714 |
| C V (%) | 6.279 | 9.642 | 9.824 | 5.847 | 6.768 | 3.418 |
The recovery of spiked at three different levels in samples throughout the range of the assay was evaluated in various matrices.
| Sample Type | Range(%) | Average Recovery(%) |
|---|---|---|
| Serum (n=8) | 88-112 | 90 |
| EDTA plasma (n=8) | 95-99 | 99 |
| Cell culture media (n=8) | 86-99 | 89 |
Samples were spiked with high concentrations of target proteins and diluted with Reference Standard & Sample Diluent to produce samples with values within the range of the assay.
| Serum (n=5) | EDTA plasma (n=5) | Cell culture media (n=5) | ||
|---|---|---|---|---|
| 1:2 | Range (%) | 92-95 | 103-118 | 91-109 |
| Average (%) | 93 | 111 | 101 | |
| 1:4 | Range (%) | 95-115 | 96-116 | 103-110 |
| Average (%) | 103 | 103 | 107 | |
| 1:8 | Range (%) | 91-105 | 84-107 | 86-109 |
| Average (%) | 92 | 98 | 95 | |
| 1:16 | Range (%) | 98-117 | 85-105 | 97-115 |
| Average (%) | 102 | 98 | 106 |