When get the ELISA data, many researchers are confused about the processing of it. So how to process the Elisa data? Today, Reed Biotech will give the answers.
Processing steps of raw data
Step 1: After getting the original ELISA data, the OD value we need is the corrected OD value, as shown in the figure below, and the corrected OD value is the difference between the original OD value and the OD value of hole 0 (this step is required for the sandwich detection method, and can be ignored for the competitive detection method).
|
Concentration |
Original OD |
Corrected OD |
|
2000 |
2.342 |
2.292 |
|
1000 |
1.548 |
1.498 |
|
500 |
0.882 |
0.832 |
|
250 |
0.442 |
0.392 |
|
125 |
0.216 |
0.166 |
|
62.5 |
0.139 |
0.089 |
|
31.25 |
0.091 |
0.041 |
|
0 |
0.05 |
0 |
Step 2: Copy the data in the previous step (the data in the red box in the figure of step 1) into Origin, select all the data, click “Analysis”, next click “Fitting”, then click “Nonliner Curve Fit”, and last click “Open Dialogue”.

Step 3: After completing the Step 2, next click “Function Selection” on the left, then click “Category” on the right, and select “Statistics”, last select “Logistic" in “Function”.


Step 4: Click “Fitted Curves” and then select “Same as Input Data” in “X Data Type”

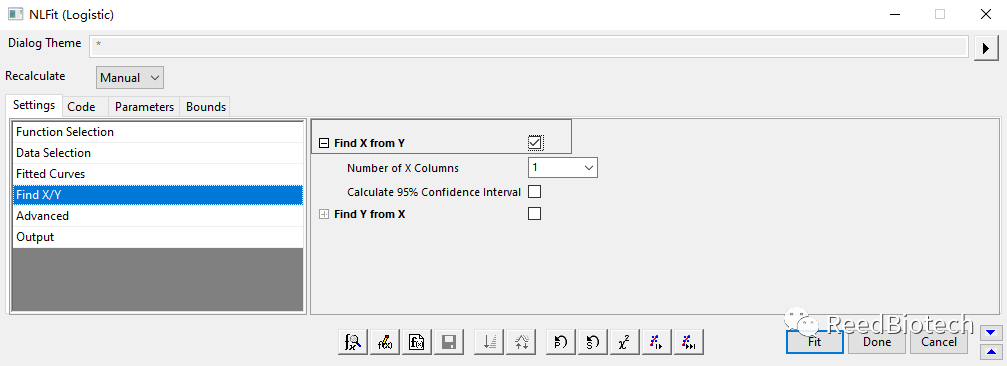
Step 5: Click “Find X/Y”, then select “Find X from Y”, and last click “Fit”
Step 6: The software will show the following interface, slide down to check whether R square is larger than 0.99 (red box has been marked), then click the “Fitted Curves Plots” as below figure (red box has been marked)
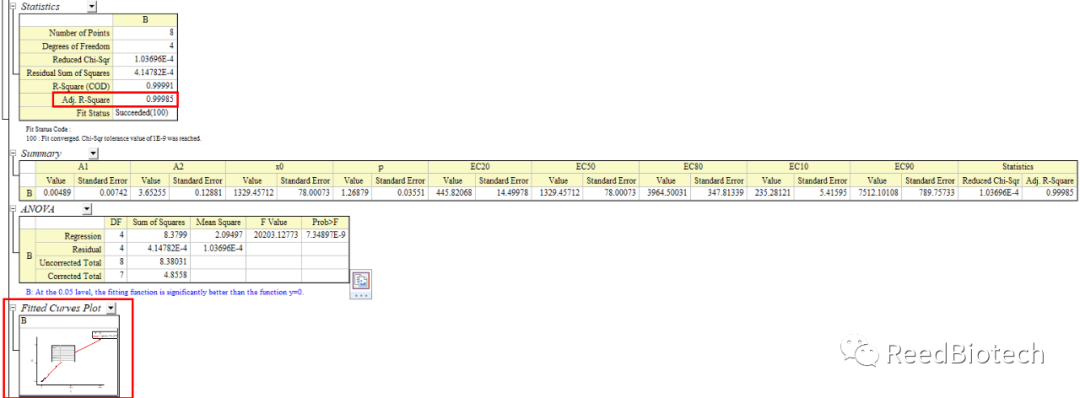
Then get

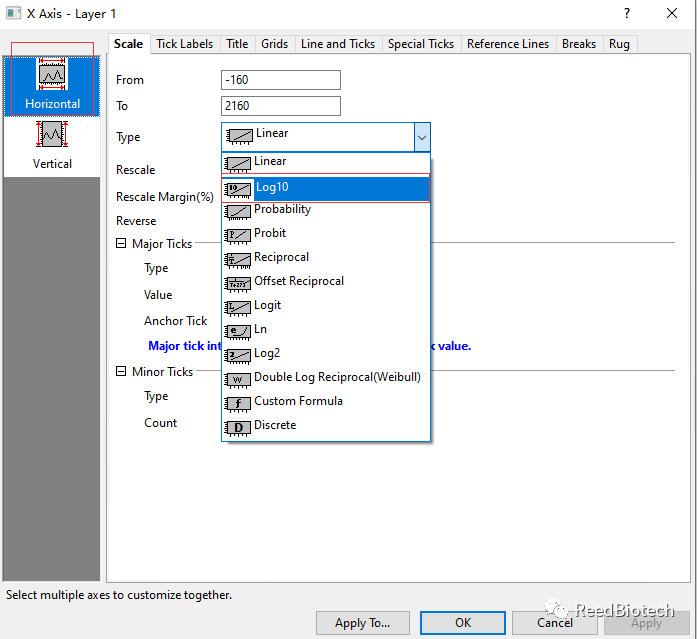
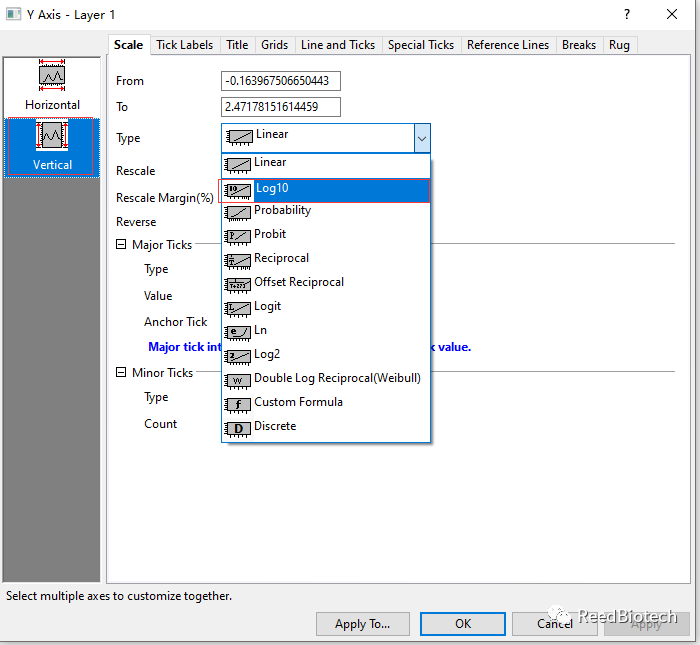
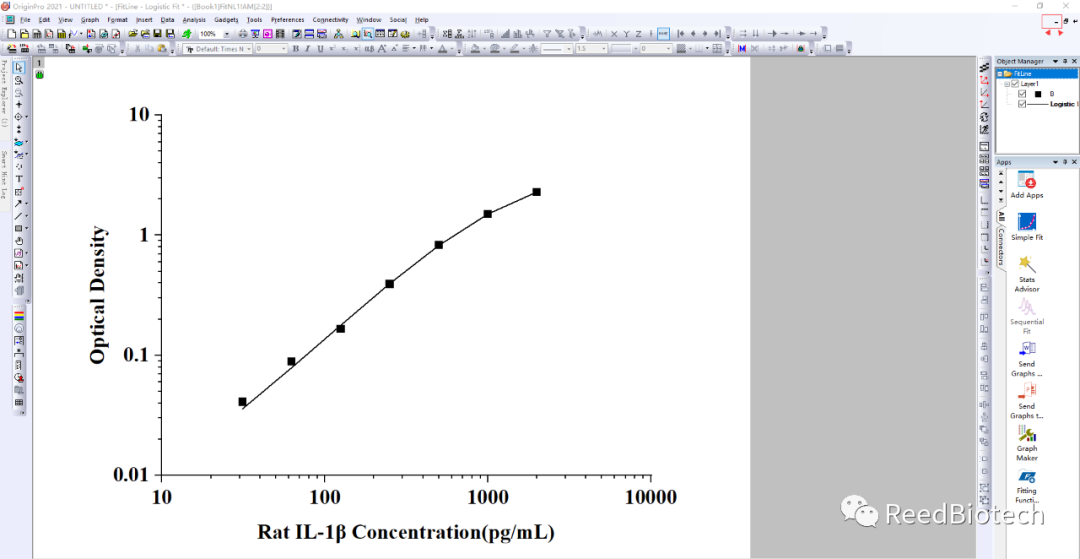
Step 7: Click A in the figure, enter the species target and concentration (unit) (recommended to write English) ; Click B in the figure to enter the full English name of OD; The color of the curve can be changed by double-clicking the curve. Double-click X-Axis to Log X and Y: click “Horizontal” and select “Log10” in Type to adjust the range of X-Axis; Click “Vertical” and select “Log10” in Type to adjust the range of Y-Axis. Finally, get the ELISA standard curve.
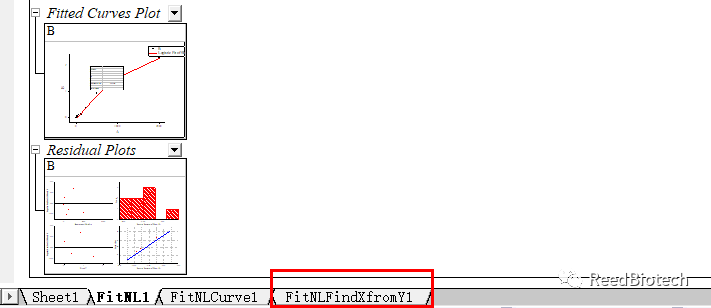
Step 8: Click Back (the red boxes and arrows are highlighted) and click “FitNLFindXfromY1”
Step 9: Input the corrected OD value to get the concentration of relevant targets in the sample. If the sample has been diluted, the final sample concentration shall be the calculated concentration multiplied by the appropriate dilution.

This is how Origin processes the ELISA data.