In protein research, accurate quantification is the foundation of experimental success. The main conventional protein quantification methods are as follows:
|
Method |
Principle |
Advantages |
Limitations |
Application Scenarios |
|
BCA Assay |
Copper ion complexation color reaction |
Compatible with detergents, high sensitivity |
Interfered by reducing agents and chelating agents |
Lysate samples containing SDS/Triton |
|
Bradford Assay |
Coomassie Brilliant Blue G-250 binds to proteins |
Fast (5 minutes), economical, compatible with reducing agents |
Interfered by detergents, narrow linear range |
Pure protein solutions without detergents |
|
UV Absorption |
Absorbance of aromatic amino acids at 280nm |
No reagents required, non-destructive detection |
Low sensitivity, interfered by nucleic acids |
Rapid detection of column eluates |
|
Lowry Assay |
Improved biuret-Folin-Ciocalteu color reaction |
High sensitivity |
Tedious steps, high toxicity of reagents |
Historical method, rarely used now |
Ⅰ.Why is BCA Total Protein Quantification Necessary for ELISA Detection of Tissue Samples?
In ELISA experiments with tissue samples, BCA total protein quantification serves as the "gold standard" for data normalization, with its significance reflected in three aspects:
1. Eliminating Inter-sample Variations
Differences in tissue block size, cell density, and lysis efficiency can lead to significant variations in total protein concentration. Directly comparing the absolute OD values measured by ELISA is analogous to "comparing the absolute weight lifted by athletes of different body weights"—it is meaningless.
|
TNF-α (pg/mL) |
Protein Concentration (mg/mL) |
Relative Concentration (pg/mg) |
|
30.037 |
0.97 |
30.966 |
|
28.094 |
0.78 |
36.018 |
|
25.636 |
1.03 |
24.889 |
|
24.375 |
1.07 |
22.780 |
|
29.378 |
1.05 |
27.979 |
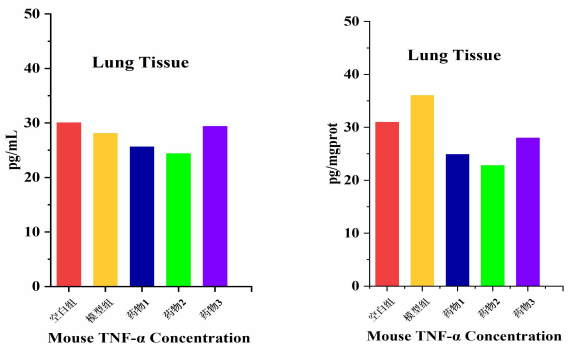
Comparison of TNF-α Differences Among Groups Before and After BCA Total Protein Quantification
2. Quality Control Indicator
-Evaluation of lysis efficiency: Low total protein concentration indicates insufficient lysis or sample degradation
-Identification of abnormal samples: If the BCA value of a sample deviates by more than 30% from the mean, repeat the experiment or exclude the sample
3. Verification of Experimental Reproducibility
During manuscript submission, reviewers will inevitably ask: "Have the ELISA data been normalized to total protein?" Publishing ELISA results without BCA quantification is regarded as an experimental design flaw and may lead to rejection
Ⅱ.Core Principle of the BCA Assay
Based on the biuret principle, proteins reduce Cu²⁺ to Cu⁺ under alkaline conditions. BCA chelates Cu⁺ as a chromogenic agent to form a blue-purple complex, which can be detected at a wavelength of 540-590nm, with the maximum absorbance at 562nm. The color of the reaction product has a linear relationship with protein concentration within a certain range, so the protein content can be determined according to the absorbance value
Ⅲ.Experimental Procedure
Preparation of Working Solution
Mix Reagent A and Reagent B at a volume ratio of 50:1 to prepare the BCA working solution. For example, mix 50 mL of Reagent A with 1 mL of Reagent B to prepare 51 mL of BCA working solution. Precipitation may form when the two are mixed; the precipitation will disappear after thorough mixing
Preparation of Standard Solution
Before use, take 20 μL of 5 mg/mL BSA protein standard solution and dilute it to 100 μL with PBS solution to a final concentration of 1.0 mg/mL. Set the concentration gradient: 0, 25, 125, 250, 500, 1000, 1500, 2000 μg/mL
a. Add an appropriate volume of the test sample and make up to 20 μL with PBS
b. Add 200 μL of BCA working solution to each well of the microplate, mix well, and incubate at 37°C for 30 minutes (alternatively, incubate at room temperature for 2 hours or 60°C for 30 minutes)
c. Measure the absorbance at 562 nm and record the readings; use the absorbance value of the sample without BSA as the blank control
Note: Complete the reading within 10 minutes after cooling to room temperature to avoid temperature drift affecting the results
d. Plot a standard curve with the absorbance at 562 nm as the ordinate and BSA content as the abscissa, and calculate the protein concentration in the sample. If the obtained protein concentration is not within the range of the standard curve, dilute the sample and re-determine
Note: Since the color of the BCA assay continues to deepen over time and the rate of the chromogenic reaction is related to temperature, a new standard curve must be prepared for each assay
Ⅳ.Notes:
1.The experimental consumables should be rinsed twice with deionized water and dried; residual detergents will inhibit the chromogenic reaction.
2.A new standard curve must be prepared for each experiment: differences in reagent batches and incubation conditions can cause curve shifts.
3.High-lipid samples such as brain tissue require acetone defatting pretreatment.
4.It is recommended to aliquot and store samples at -80°C immediately after collection to avoid protein degradation caused by repeated freeze-thaw cycles.