Three Soul-searching Questions
1. Does the OD value difference between duplicate wells on the same plate exceed 0.2?
2. Does the gradient dilution cause more fluctuations?
3. Did the standard curve fit R² = 0.94, and the paper was rejected by the reviewers?
Don't rush to blame the kits; 90% of the problems may lie here.
Ⅰ. Reagents Themselves: Loss of Control at the Source Leads to Total Waste
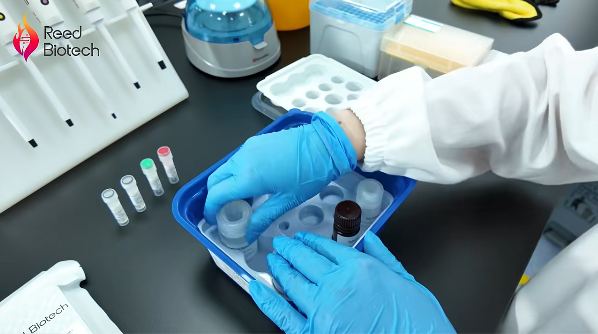
1, Improper Storage of Standards
Standards Denature or Degrade Due to improper storage temperatures (too high or too low), repeated freeze-thaw cycles, or expiration, these standards can cause them to denature or degrade. This can lead to inaccurate concentrations of prepared standards, especially at high concentrations, causing a greater drop in OD values, resulting in a lower R². Alternatively, the standard aliquots may be too small, leading to evaporation and resulting in dispersion at high concentrations.
2, Deterioration or failure of key reagents
Uneven coating of the antigen/antibody can lead to significant binding variations between wells at the same concentration, increasing OD value dispersion. In addition, the enzyme conjugate, color developing solution, stop solution, etc. are precipitated or not stored away from light as required, resulting in insufficient color development in high-concentration wells or abnormal color development in low-concentration wells.
Ⅱ. Experimental Procedure: Hand tremors can cause dots to fly away.
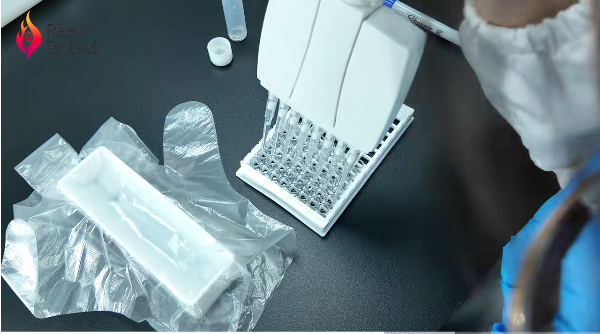
♦ Incomplete dissolution of the standard powder or insufficient mixing after dissolution can lead to different actual concentrations in standard solutions of the same concentration, increasing variability between wells.
♦ Improper handling during serial dilution of the standard, such as insufficient pipetting, which allows protein to adsorb to the inner wall of the pipette tip; using a vortex to mix or pipetting too quickly, which increases bubbles and leads to inaccurate pipetting. Furthermore, incorrect or missed wells during sample addition can disrupt the linearity of the standard curve, resulting in a low R².
♦ Failure to follow the manufacturer's instructions when diluting key reagents, such as the enzyme conjugate, chromogen, and stop solution, can result in overly strong or weak signals, deviating from the linear detection range.
Furthermore, excessive washing of the plate leads to the elution of enzymes bound to high-concentration Wells, resulting in low OD values. Incomplete plate washing can also lead to nonspecific color development, resulting in high OD values, disrupting the linearity of the standard curve and naturally reducing R².
Ⅲ.Sample Pipetting and Incubation: The Microenvironment Within the Plate Determines Discreteness
Excessive sample pipetting time can cause the slope of the calibration curve to flatten. Inaccurate incubation temperature (incubator temperature fluctuation > ±1°C), excessively long or short incubation times, and edge effects during incubation (evaporation from edge wells causes an increase in OD values) can increase the CV of the entire plate and affect R2.
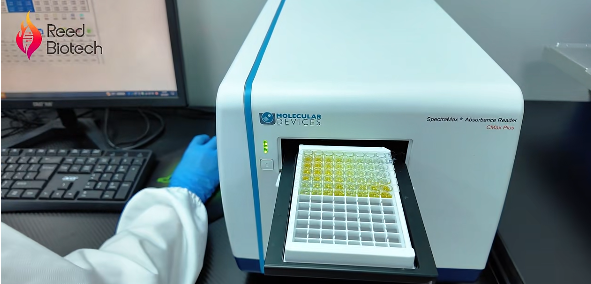
IV. Detection and Calculation: Stumbling at the Final 5 Minutes
Improper control of chromogenic time—excessive duration leading to substrate depletion—can cause OD values in high-concentration wells to plateau, while OD values in low-concentration wells continue to rise. Inconsistent termination of the reaction, with significant variations in the speed of adding the stop solution, increases the OD value disparity among standard samples of the same concentration. Additionally, errors during measurement with a microplate reader, such as incorrect wavelength selection or failure to exclude outliers, can disrupt the linearity of the standard curve, ultimately resulting in a reduced R² value.
"The kit is not a magic box. Reliable data = 50% kit quality + 50% operational skill." Why do others consistently achieve perfect R² values when testing the same indicators?
Because they quietly use ReadyBiotech's ELISA kits. Purchase our ELISA kits and receive complimentary 'assay service'—leave the challenges to us, while you focus on publishing with 0.999 R² data!"
Reed Biotech's Hot Picks of the Week · Kits-In Stock, Ships Instantly!
| Catalog Number | Product Name | Sensitivity | Detection Range |
| FS2792H | FS-Human IgA(Immunoglobulin A) ELISA Kit | 0.08 ng/mL | 0.78-50 ng/mL |
| FS2824H | FS-Human IgE(Immunoglobulin E) ELISA Kit | 0.06 ng/mL | 0.31-20 ng/mL |
| FS10113 | FS-Cort(Corticosterone) ELISA Kit | 2.76 ng/mL | 3.13-200 ng/mL |
| RE3054M | Mouse PD-1(Programmed Cell Death Protein 1) ELISA Kit | 2.32 pg/mL | 15.63-1000pg/mL |
| RE2867HF | MF-Human IL-17A(Interleukin 17A) ELISA Kit | 5.55 pg/mL | 7.81-500 pg/mL |
| RE10013F | MF-TGF-β1(Transforming Growth Factor Beta 1) ELISA Kit | 18.75 pg/mL | 31.25-2000 pg/mL |
| RE2731R | Rat MCP-1(Monocyte Chemotactic Protein 1) ELISA Kit | 4.58 pg/mL | 15.63-1000 pg/mL |
| RE2731HF | MF-Human MCP-1(Monocyte Chemotactic Protein 1) ELISA Kit | 4.68 pg/mL | 7.81-500 pg/mL |
| RE1060HG | Human High Sensitivity TNF-α(Tumor Necrosis Factor Alpha) ELISA Kit | 0.47 pg/mL | 0.78-50 pg/mL |
| RE1055HG | Human High Sensitivity IL-4(Interleukin 4) ELISA Kit | 0.08 pg/mL | 0.16-10 pg/mL |
| RE3006M | Mouse IL-1R1(Interleukin 1 Receptor Type I) ELISA Kit | 19.09 pg/mL | 78.13-5000 pg/mL |
Got the product code but unsure about the procedure?
Click to watch the 9-minute real-life demo video. Just follow along and you'll 100% get a perfect curve.